


Bridging Data Gaps in India’s Economy
The India Data Lab Initiative (IDLI) harmonizes and makes accessible unit-level microdata from India’s flagship household and firm surveys spanning four decades

What is IDLI
The India Data Lab Initiative (IDLI) makes India’s premier household and firm microdata easy to use, reliable, and analysis-ready. We harmonize unit-level data from major national surveys—beginning with the National Sample Surveys (NSS) and the Annual Survey of Industries (ASI)—and integrate them into a unified online platform with consistent geographical and industry identifiers.
By providing ready-to-merge microdata, IDLI lowers barriers to empirical research, enables seamless cross-survey and cross-year analysis, and supports a richer understanding of India’s households, workers, and firms.
IDLI by Numbers
IDLI provides unit-level microdata on individual firms, households, and workers over time
Lines of Code
20,000Firm x Year Observations
2,308,576Household x Year Observations
1,078,018Worker x Year Observations
3,936,936Making data analysis-ready
IDLI harmonizes data along four critical dimensions:
Data Layout Standardization
Makes survey blocks, tables, and file structures consistent across years

Variable & Label Harmonization
Ensures variable names, labels, and definitions match across survey rounds

Industry, Product & Occupation Concordances
Creates detailed concordances across industry, occupation, and product nomenclature over time

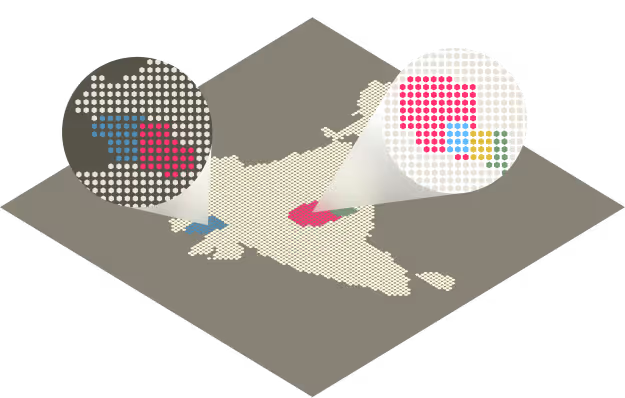
Consistent Geographic Boundaries
Aligns state and district codes, names, and borders across years
Partners




Get in Touch

Unlock India’s Economic Microdata
Access harmonized datasets from India’s leading household and firm surveys — ready for research, policy, and discovery.
